Does Law School Really Ruin Your Life?
Sorting through figures from “scam blogs,” scholarship, and popular media accounts of the decline in legal education
INTRODUCTION
For the past two years or so, it seems like each new day has brought word of tragedy wrought by disruptive change in the legal industry, especially as it relates to legal education. The narrative, by this point, is quite clear: the U.S. has an oversupply of newly minted J.D.s, who, because of the high cost of law school and easily available student loans, have accumulated huge debts that they cannot pay off. Adding to the crisis is the fact that the legal market has contracted, with law firms less willing and able to spend the time necessary to train junior associates.
Some current and former law students, and even a law professor or two, have revolted. They have created highly critical “scam blogs” railing against the hopeless situation they find themselves in and place much of the blame on law schools and the legal field generally. The national print media has also jumped into the fray, with several New York Times articles almost gleefully counting the ways in which law school is a poor career choice for many. As a current law student, these kinds of things are hard to avoid.
For the past year, I have been researching changes in the legal profession and the market it has created, but I have had trouble sorting out the story buried in the often cited numbers contained in scam blog posts, academic works, or news reports. On this site, I have gathered a wide variety of source material and data to tell a story and to present a challenge — if you are considering going to law school, will deciding to go really ruin your life? To that end, I’ve prepared several easy-to-grasp visualizations about law school applications, debt, employment after graduation, and the current crisis in the legal market.
FIRST THINGS FIRST: WHAT’S ALL THE FUSS ABOUT?
Well, it seems like there must be fire here since there certainly is smoke. Students have stopped applying to, and enrolling in, law school. They are also not taking the LSAT as much. Check out how the figures have changed over the last decade or so:
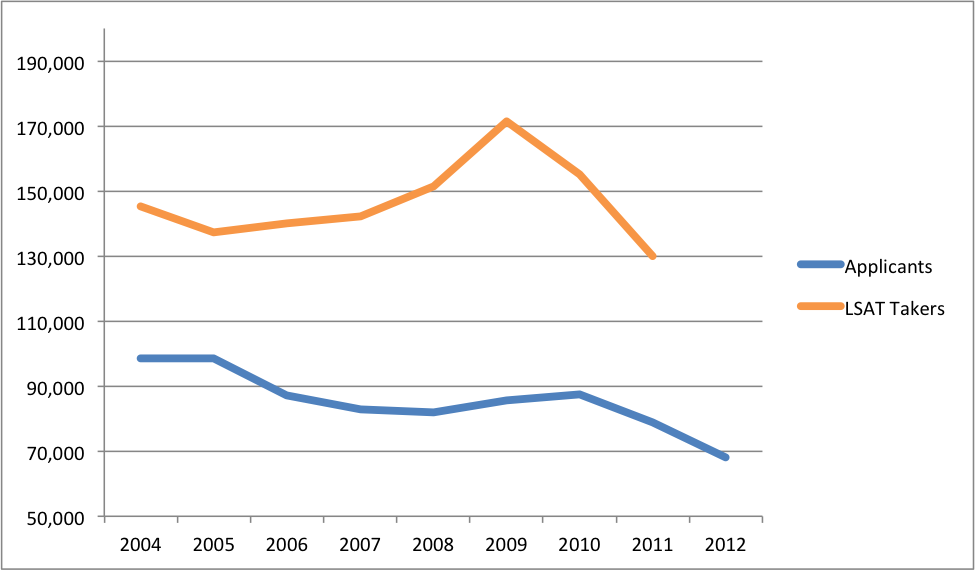
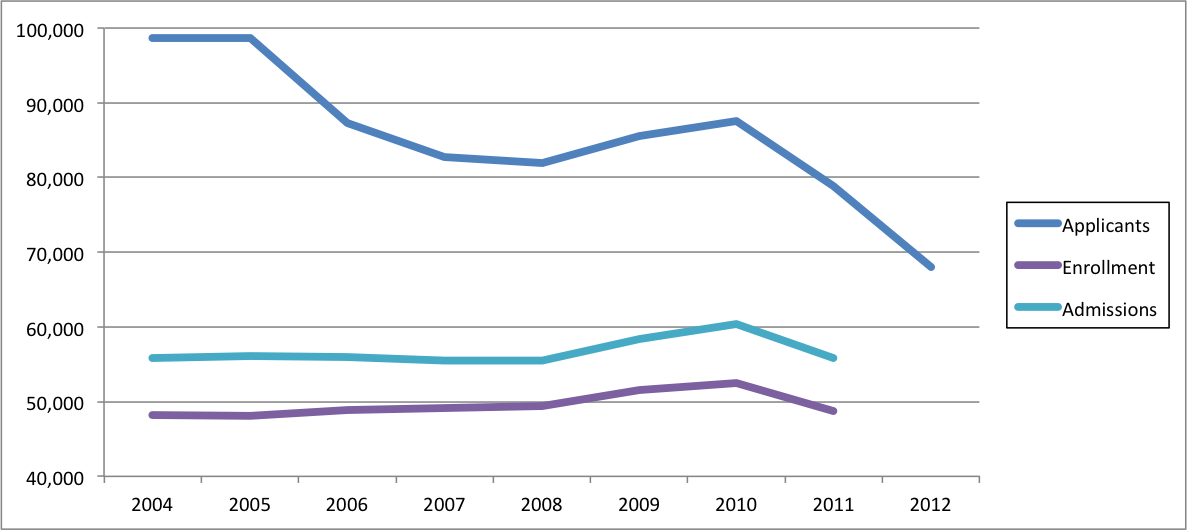
Source: Law School Admission Council
TUITION AND BORROWING
Average tuition and the amount of money students borrow has grown tremendously in the past decade.
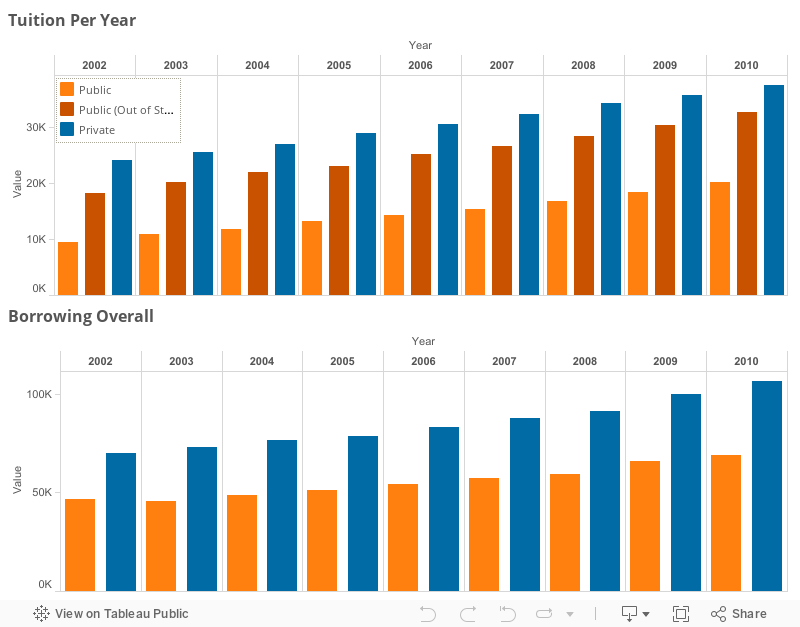
Source: the American Bar Association (Tuition) and (Borrowing)
Perhaps more interesting is the percentage change from year to year:
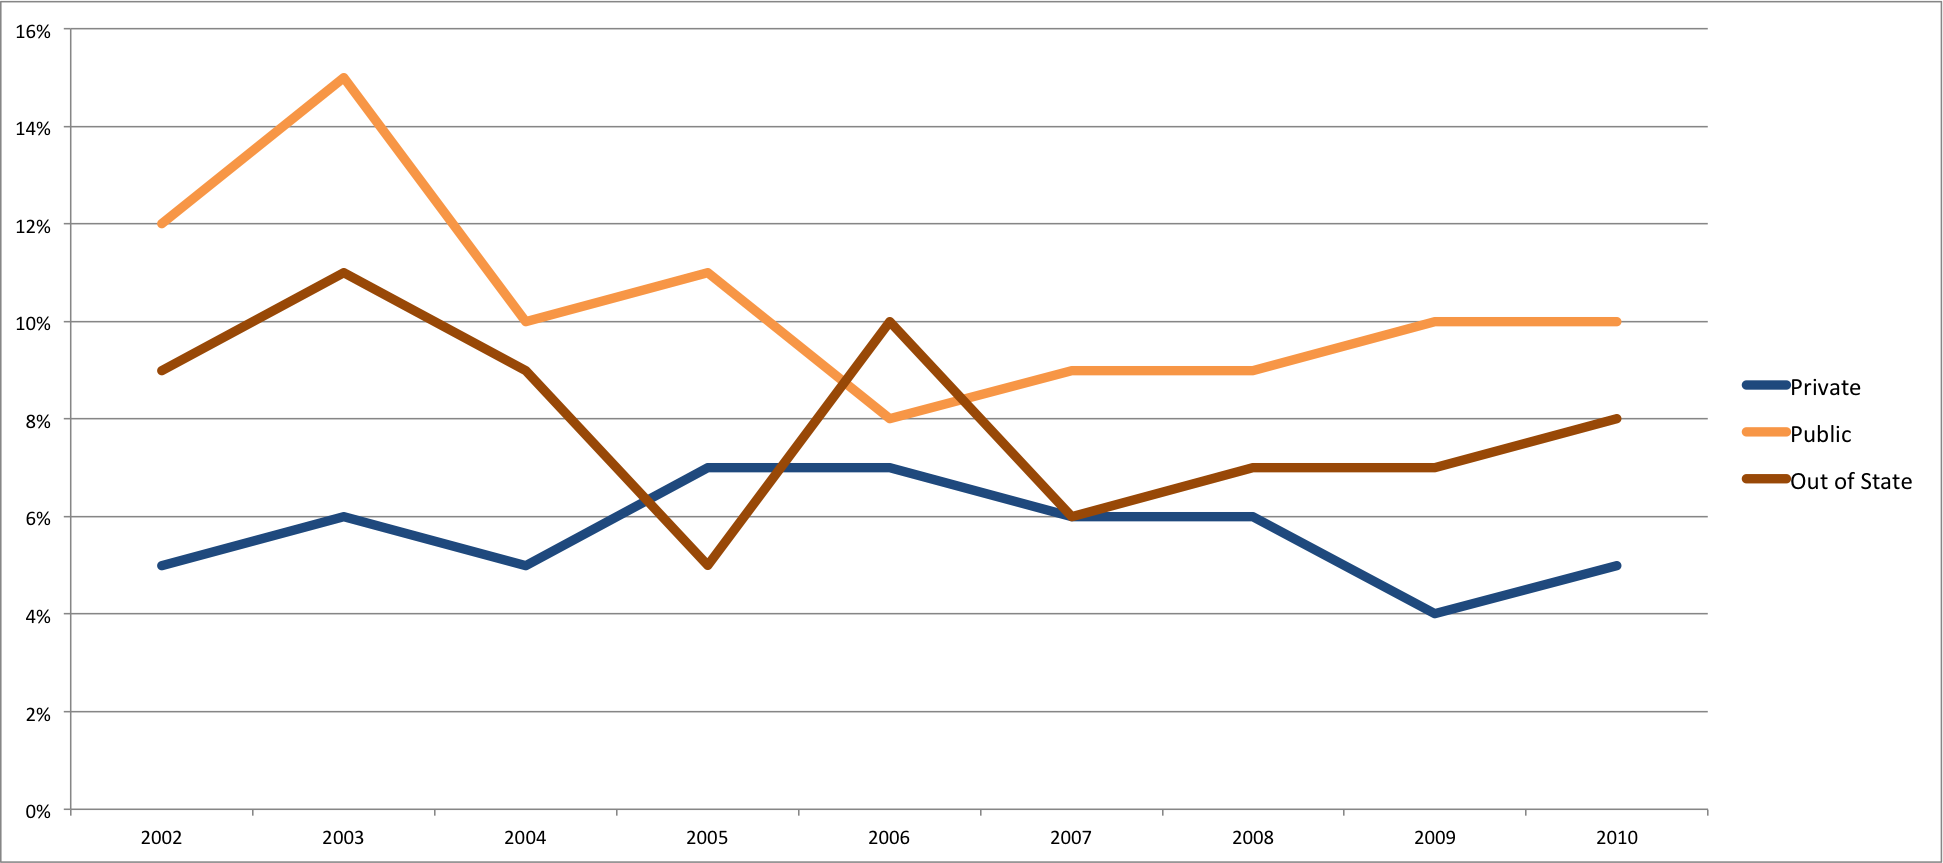
Source: American Bar Association
(Notice that while the percent of tuition increases is dropping, tuition is still increasing by a whole lot each year, as you can see above. Think about it this way: 10% of $5,000 is $500 while 5% of $10,000 is also $500.)
Math lesson aside, the average law student who borrows money to attend school graduates with $100,000 in debt. The median salary of a law school graduate is $63,000 per year. But what kind of job will a law school graduate have?
EMPLOYMENT AFTER GRADUATION
We now know that law schools had been enticing students with misleading reports of how many of their graduates were employed 9 months after law school—sure, lots of students were employed, just not in jobs that both required a J.D. and were full time! (And some schools are still doing this!)
Applicants are now savvy enough to look for this kind of blatant manipulation. But here’s a new wrinkle: Many law schools are now creating jobs for their graduates within the law school itself to boost the all-important J.D.-required, full-time employed statistic. Some academics have rightly criticized the schools for this, and have created big tables using the data to show the “reported” employment figures (from law school career counselors) in contrast to the “adjusted” figures, which do not include law-school created jobs. In the graphic below, you can compare as many schools as you’d like (though any more than six or seven will make things look a little crowded) and see which ones are employing a large chunk of their graduates on campus after they graduate:
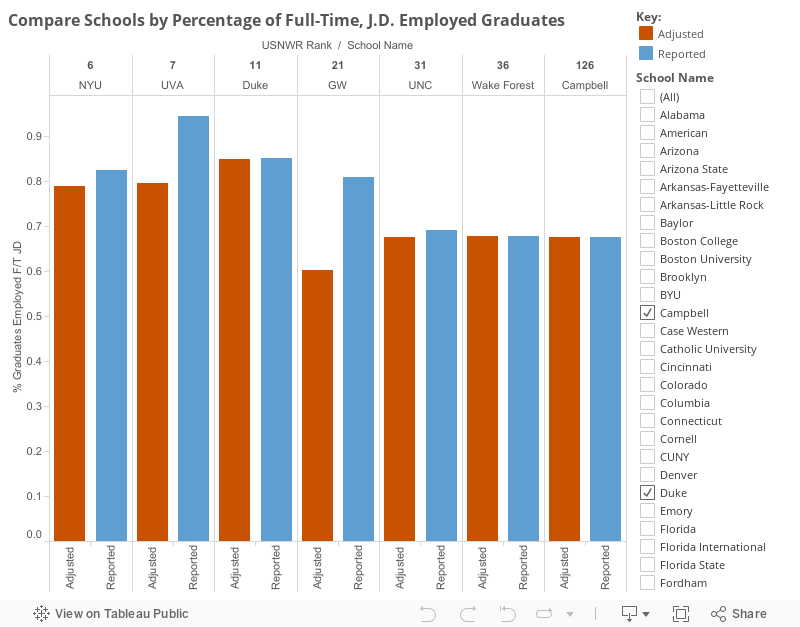
Source: Compilations of American Bar Association Data by Professors Gary Rosin and Dan Filler and 2014 ranking data from the much-maligned U.S. News & World Report
JDs AND THE LEGAL MARKET
Is there a glut of JDs? Use the slider below to compare JDs awarded by year since 1970:
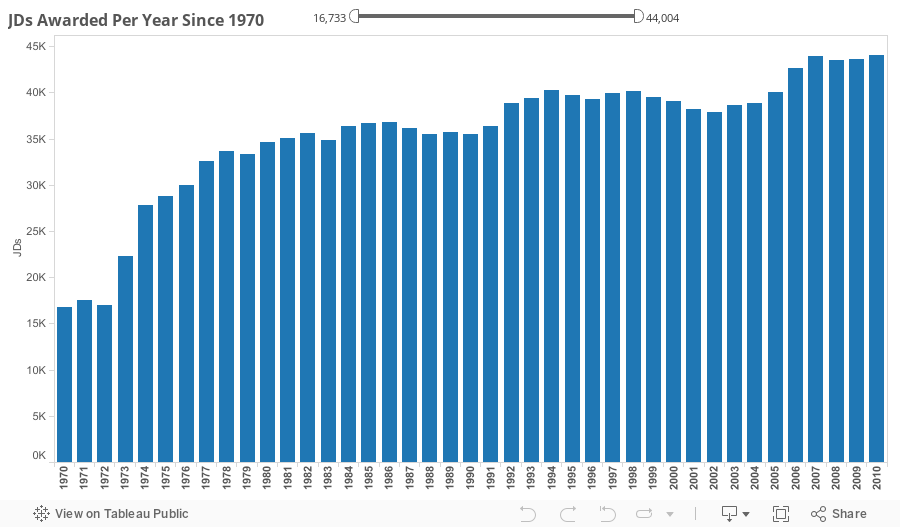
Source: American Bar Association
How many new legal job openings will there be for new graduates each year (for each the next five years) compared with how many graduates pass state bar exams? You can play around with the first visualization by adding or subtracting states for relative comparisons. Use the table that follows for easily finding a state of your choice, its surplus (or lack thereof), and the median salary of an entrant into the legal market.

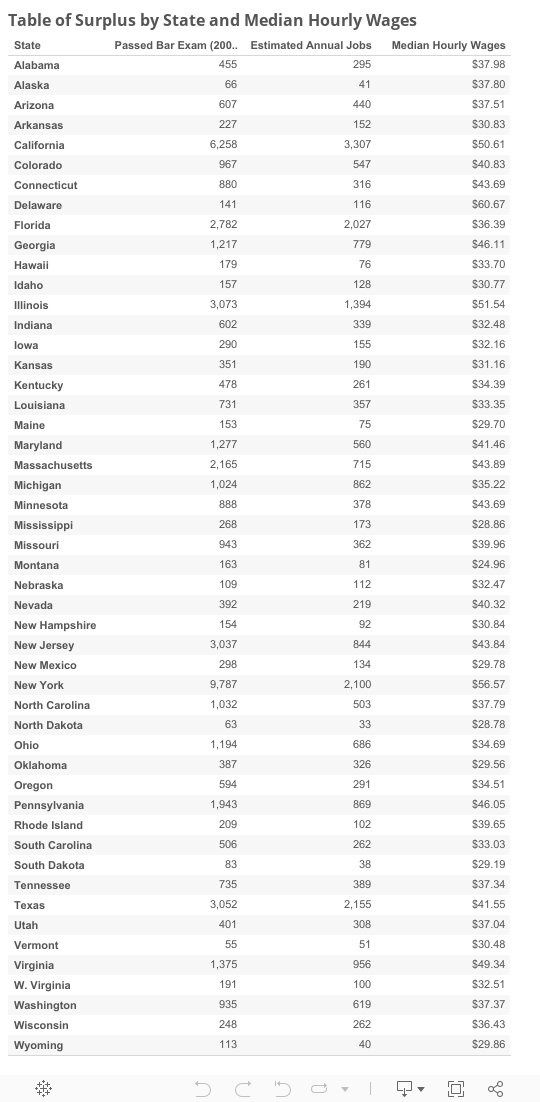
Source: “The Lawyer Surplus, State By State” New York Times*
*Note: This source has since been updated with estimates from Washington, D.C. At the time the visualization was created, this data wasn’t yet published and is therefore not included. I might choose to update in the future depending on time available, whim, and the general idea of letting a two-year-old work stand for what it is.
Further reading:
NEWS REPORTS
New York Times: Is Law School a Losing Game?
New York Times: Law Students Lose the Grant Game as Schools Win
Wall Street Journal: Law Grads Face Brutal Job Market
BLOGS AND WEBSITES
Inside the Law School Scam (No longer updated)
Law School Transparency
Above The Law
BOOKS
Harper, Steven. The Lawyer Bubble (2013)
Morgan, Thomas. The Vanishing American Lawyer (2010)
Tamanaha,Brian Failing Law Schools (2012)
Susskind, Richard. Tomorrow’s Lawyers (2013)
Methodology
CUT-DDV Framework
This page was created as the final project for INLS 541: Information Visualization, taught by Dr. Bradley Hemminger at the University of North Carolina at Chapel Hill in the Spring of 2013. He asked that we explain a bit about our process for creating these visualization. His framework of CUT-DDV looks at several factors:
- C – Context, U – User, and T – Task:
- I imagine that a prospective law student or any person advising a prospective law student could use these visualizations to help cut through some of the confusion surrounding current attitudes toward attending law school. The visualizations and narrative content of the page are meant as a starting point for embarking on some of the further reading listed below (indeed, most of the sources for my figures are drawn from the footnotes). A few of the visualizations are interactive and invite the user to explore on his or her own. Others are not interactive and serve to aid in cognition and create more indelible images of abstract, often overwhelming numerical data.
- D – Data, D – Display, and V – Visualization Technique:
- The data I worked with was for the most part continuous, categorical, and, in some cases, interval. I chose display options that have been shown to be both more immediately comprehensible by the the eye-brain system (such as using bars and lines with as little “ink” as possible) and also safe for users who may have color-blindness. The visualization techniques should be familiar to most users and require little to no training to understand.
DATA HANDLING
In some instances, I made decisions to group data together—for instance, the number of LSAT test takers (from LSAC) and the number of JDs per year (from the ABA) were both measured in intervals or bins that stretched across two years but really only counted a single year’s time. In those cases, I chose the first year in the pair (i.e. 2004 for 2004-2005) to make for more easy comparison. The only exception to this was the data about student borrowing, which worked better using the latter year (to more accurately compare the with the way tuition data was measured by the ABA).
The only time I excluded data was for the interactive graphic featuring graduate employment and USNWR ranking. I chose only about 115 of the 200 or so law schools currently operating in the U.S. I kept the top 100 in the USNWR rankings and then editorially selected an additional number of “high performing” but “lower tier” schools. I didn’t see the use in including the law schools who routinely cannot place at least 40% of their graduates in full-time, JD-required jobs, even though this was an initial element of the law school scam stories.
All of the datasets I created for these visualizations can be downloaded from the following links:
lsac_data
tuition_and_borrowing
employment
jds_per_year
bar_passage_surplus

Law School, Visuaized by www.aaronkirschenfeld.com/scholarship/law-viz/ is licensed under a Creative Commons Attribution-NonCommercial-ShareAlike 3.0 Unported License.